Study by young Chilean astronomer reveals new key parameter for understanding star formation
The research, published in the journal Astronomy & Astrophysics, has national astronomer Nicolás Sandoval as lead author. The study focuses on the massive stellar protocluster G351.77, located about 6,500 light-years from Earth.
An international team of astronomers has identified a new parameter that could contribute significantly to the study of star formation. The research is led by Chilean Nicolás Sandoval, PhD student at the Center for Astrophysics and Related Technologies (CATA) and astronomer at the Universidad de Concepción (UdeC). The study was also led by Amelia Stutz, Principal Researcher at CATA and academic at UdeC.
The research focuses on the protocluster G351.77, a compact region approximately 3 light-years in diameter within a nebula, dominated by cold, dense gas. In these areas, known as massive protoclusters, the conditions necessary for the birth of new stars are found, and they are considered to be the first stages in the formation of massive star clusters.
The study, entitled “ALMA-IMF. XVIII. The assembly of a star cluster: Kinematics of dense gas in the massive protocluster G351.77,” was recently published in the journal Astronomy & Astrophysics. It analyzed the motion of gas within this “star nursery” using observations obtained with the Atacama Large Millimeter/submillimeter Array (ALMA) radio telescope, located in northern Chile.
The team discovered the presence of V-shaped structures, called V-shapes, which indicate how gas moves toward denser regions called “dense cores,” where stars are born. These structures act as channels that continuously feed the forming cores. “From measurements of collapse rates and total gas mass, we infer that the protocluster is continuously fed with gas from the surroundings, suggesting that it assembles ‘from the outside in,’” explains Nicolás Sandoval, lead author of the study.
In simple words: the protocluster, containing a large mass, generates a strong gravitational attraction that causes the surrounding gas to collapse towards the denser zones. This process is key to star formation.
The finding of these structures, also known as V-shapes, is not only relevant for understanding the internal dynamics of these regions, but could also become a new tool for identifying the evolutionary stage of star-forming regions. “This is because more evolved regions do not seem to present a large number of these structures, while they are observed in young regions,” adds Sandoval.
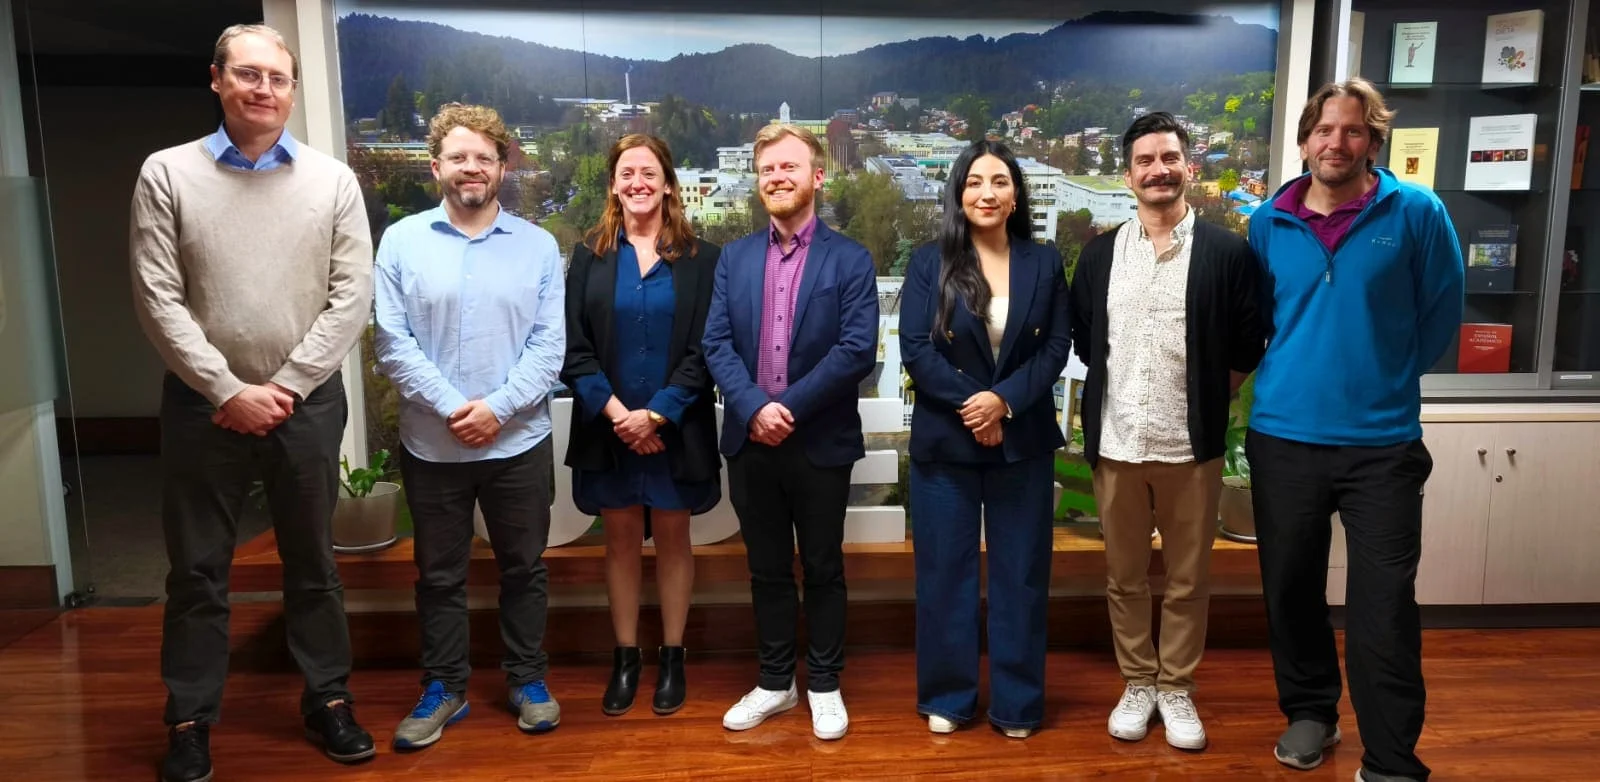
The study involved leading researchers from national and international institutions: Rodrigo Álvarez-Gutiérrez, Javiera Salinas and Atanu Koley (Universidad de Concepción); Simón Reyes-Reyes (Max Planck Institute for Astronomy, Germany); Roberto Galván-Madrid (UNAM, Mexico); Frédérique Motte and Fabien Louvet (Université Grenoble Alpes, France); Adam Ginsburg (University of Florida, USA) and Nichol Cunningham (SKA Observatory, UK).
For more than three and a half years, the team used advanced tools such as CASA software, specialized in the calibration and analysis of radio astronomy data, and Position-Velocity diagrams, which allow observing how gas moves in a specific region. These diagrams are fundamental to reveal processes such as collapse, rotation or gas outflows.
The next step, according to Sandoval, will be to apply this methodology to new ALMA observations covering the entire star-forming region that hosts the G351.77 protocluster, in order to better understand the impact of the environment on the early evolution of stars.
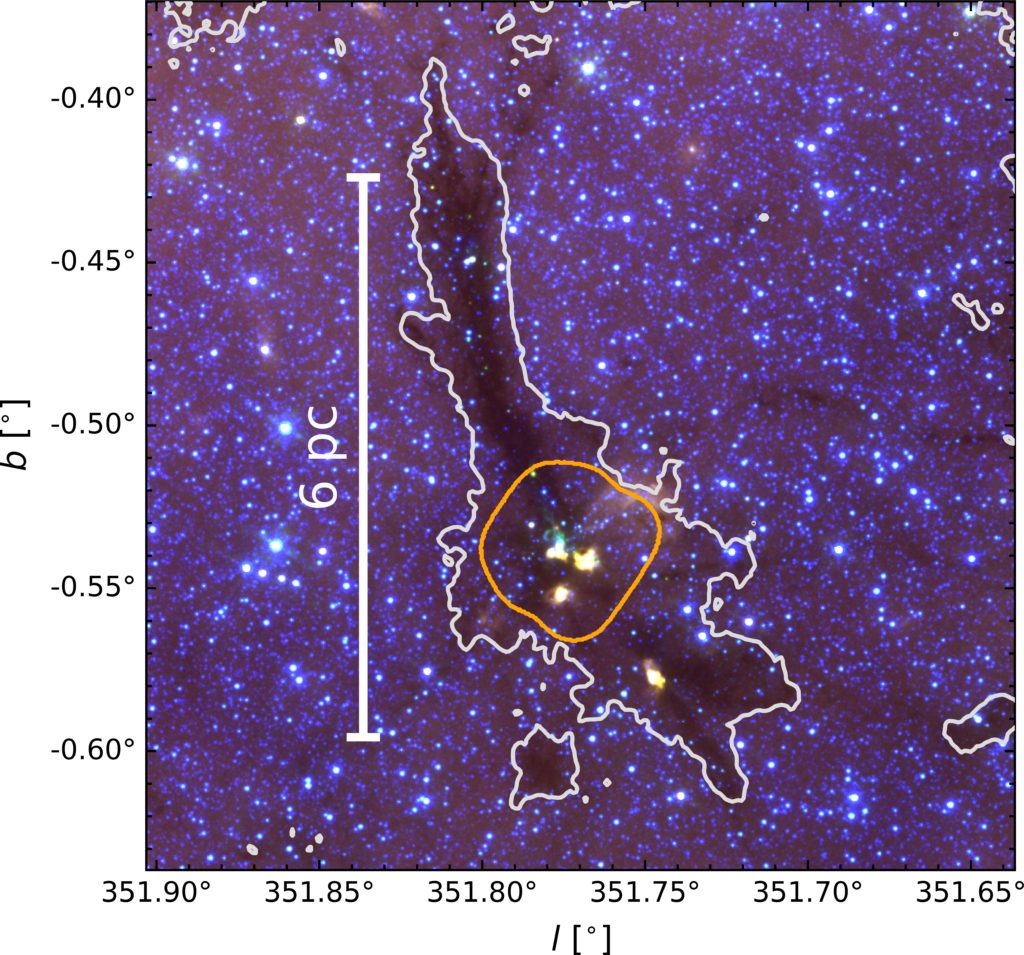
This image corresponds to the filamentary region G351.77-0.53. The white outline highlights the high-mass star-forming region in which the protocluster is located, which is indicated by the orange outline.
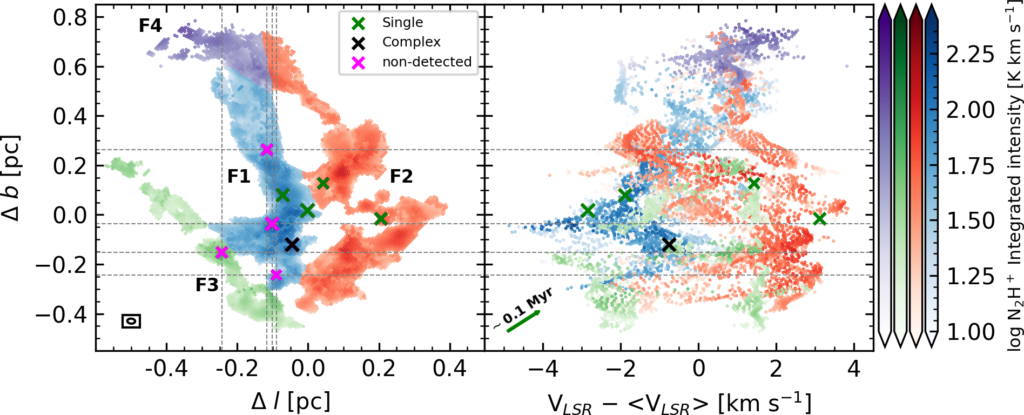
On the right side is shown a position-velocity diagram of the structures, where we can appreciate the power of kinematics in allowing the separation of different structures that are moving at different radial velocities. Among these, kinematic structures that we call V-shapes stand out, an example of one of these is the blue structure near -3 km/s. The horizontal lines and X’s show the position of the dense cores.
More information: https://www.aanda.org/articles/aa/abs/2025/04/aa52589-24/aa52589-24.html
Outstanding news
Recent news
-
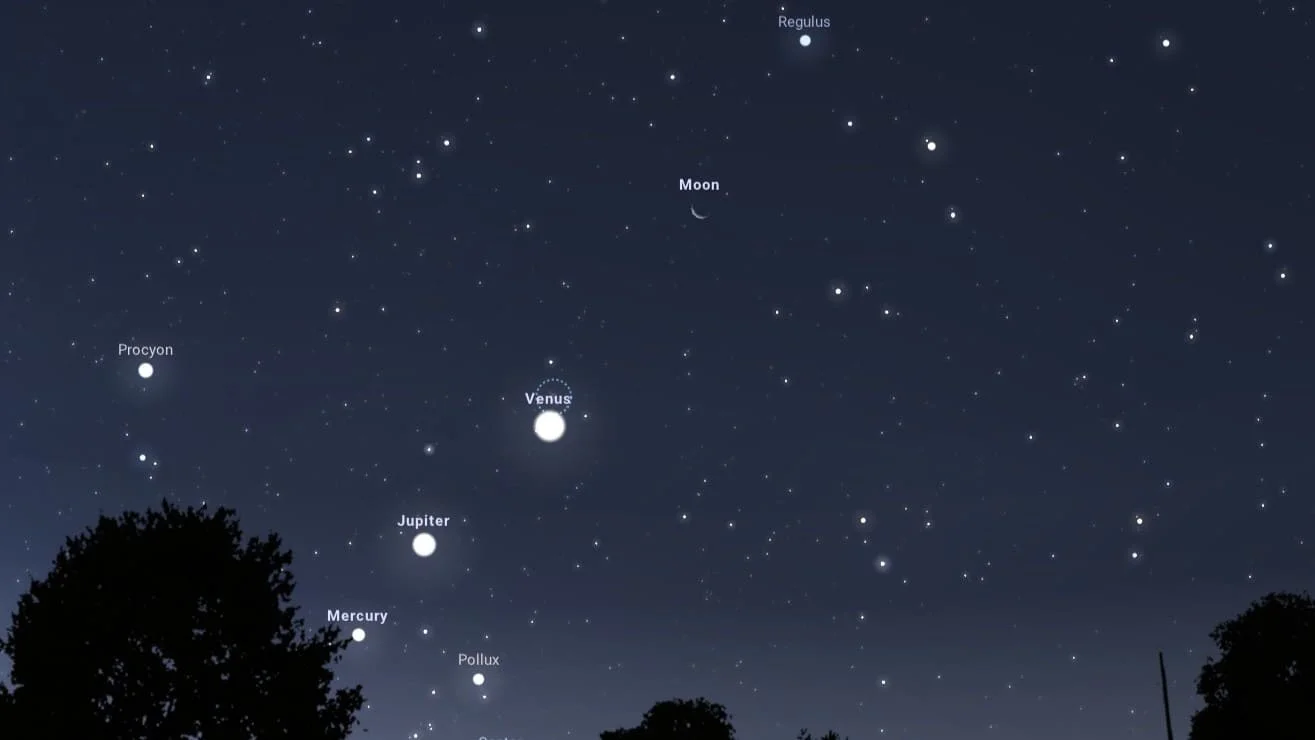 Publicado el: 15/06/2026Planetary alignment of Mercury, Venus, Jupiter, and the Moon: a spectacle visible from Chile
 -
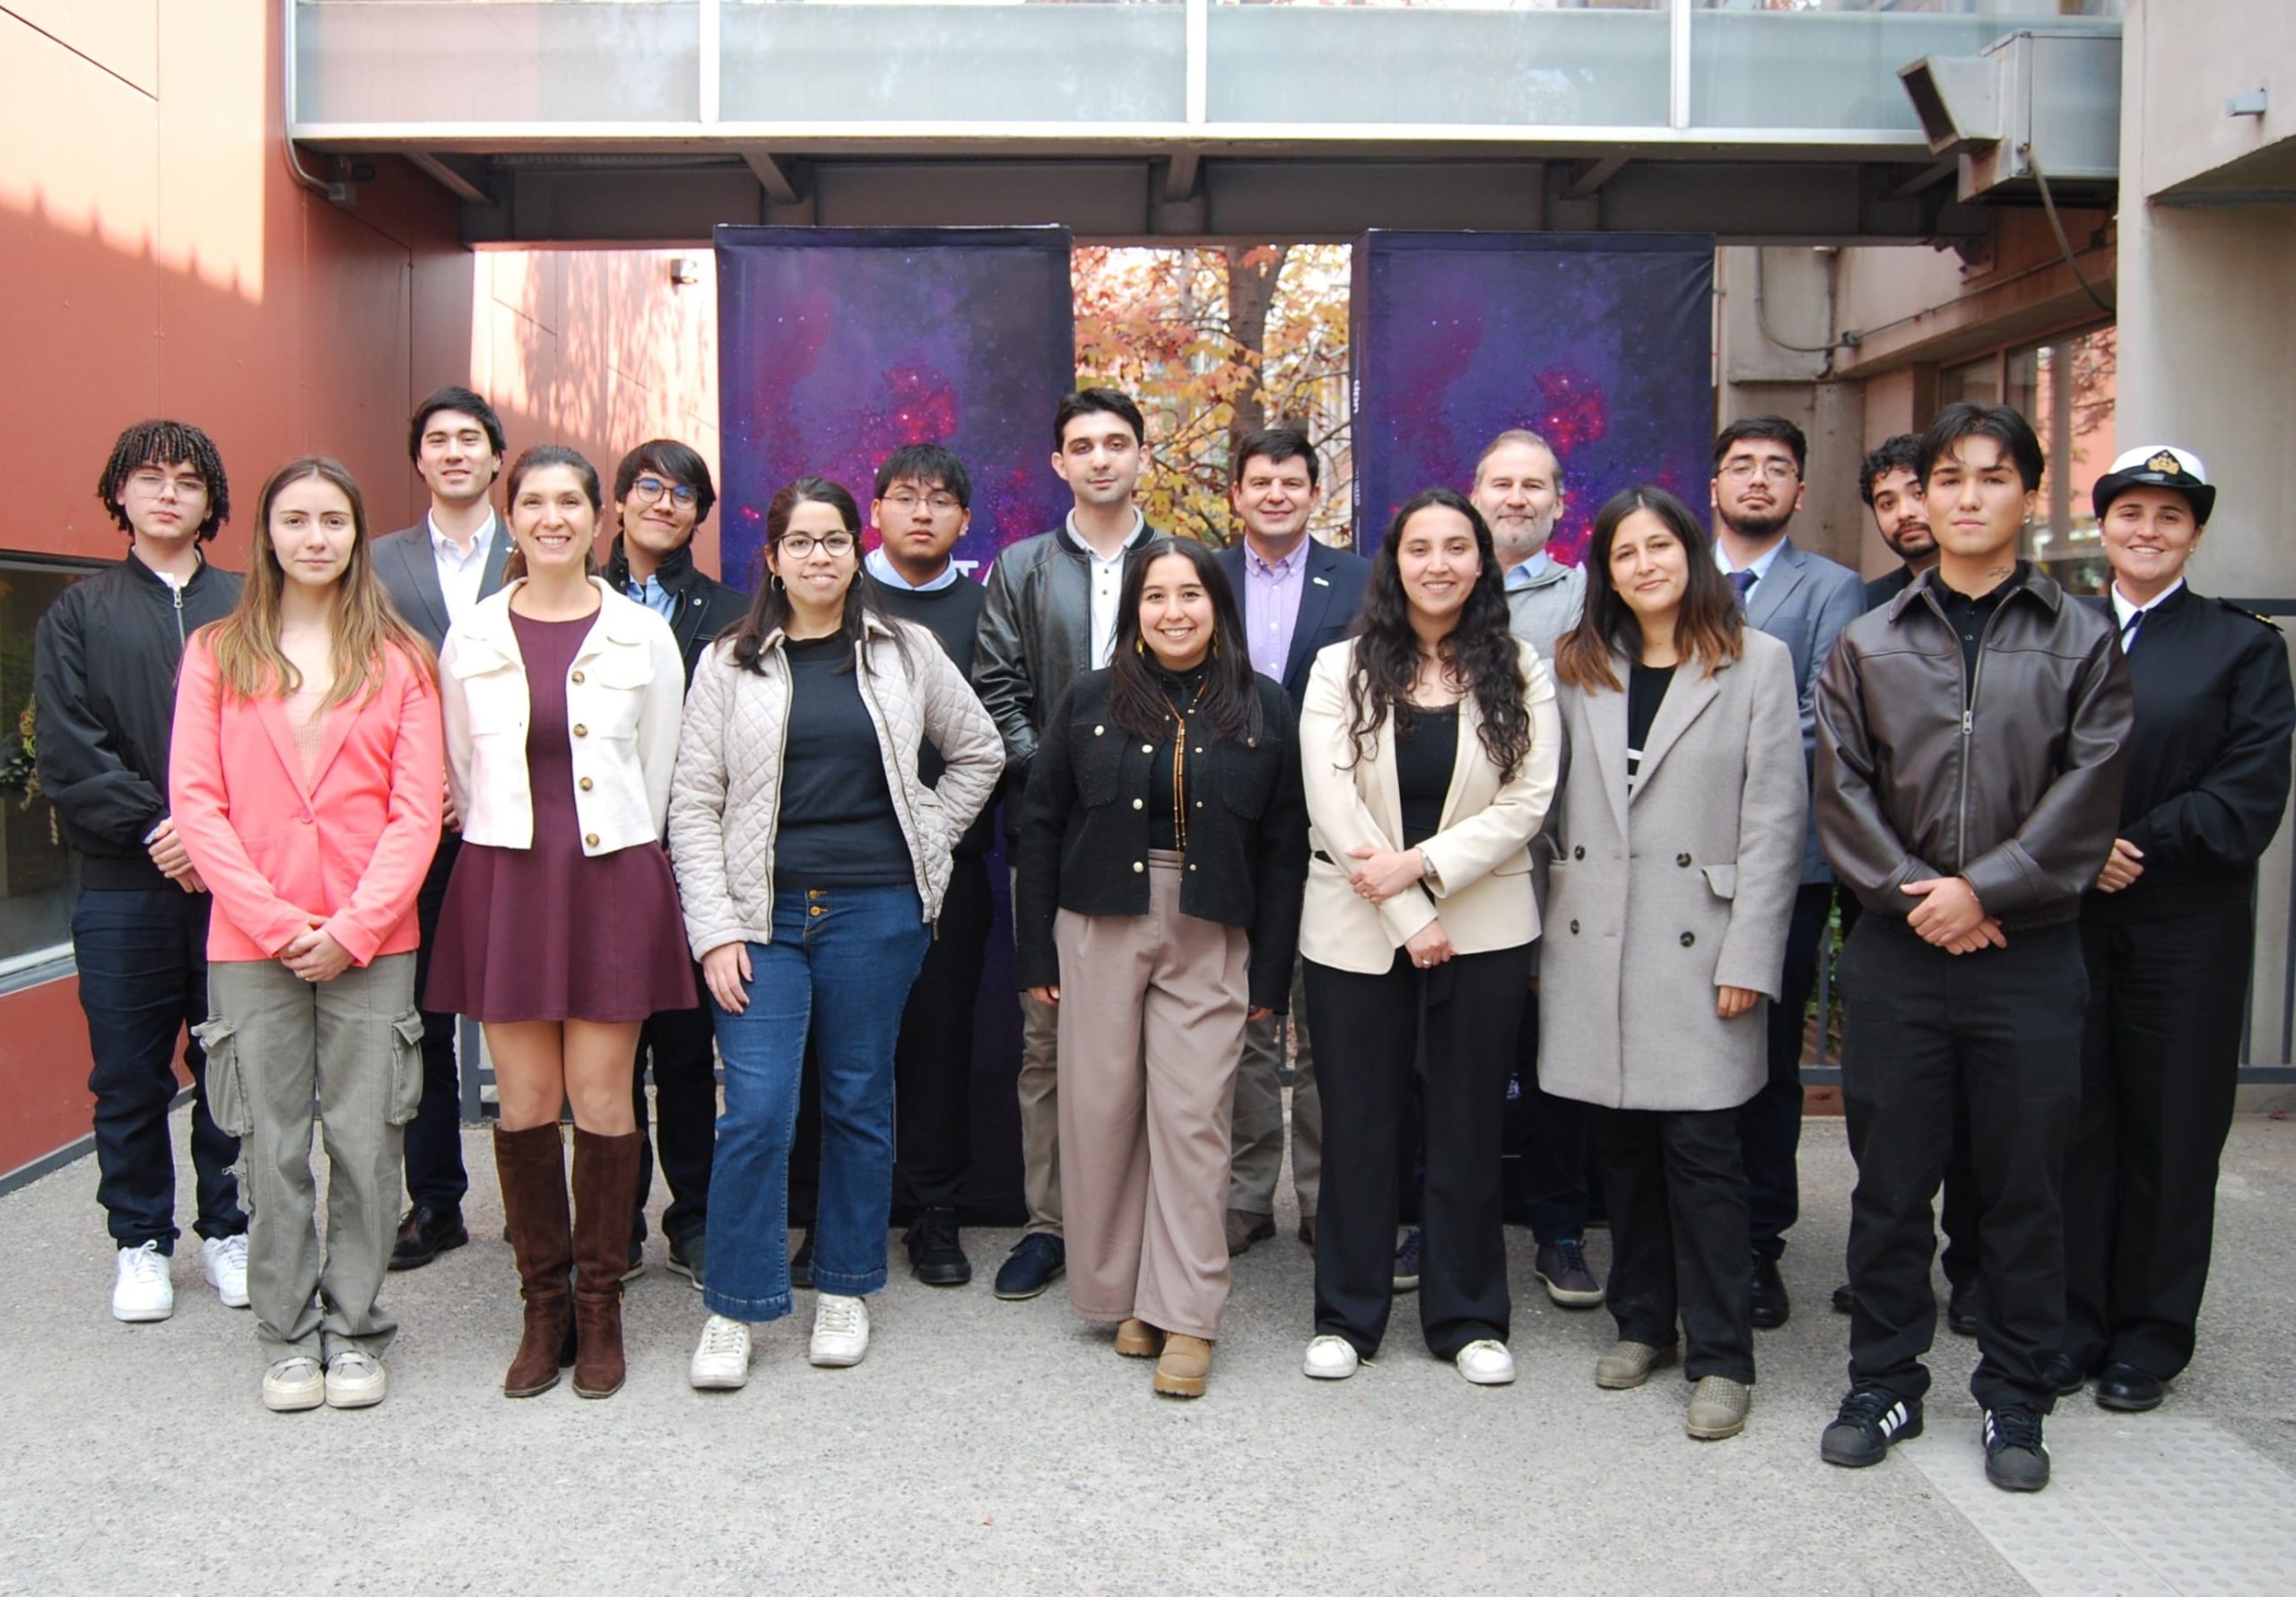
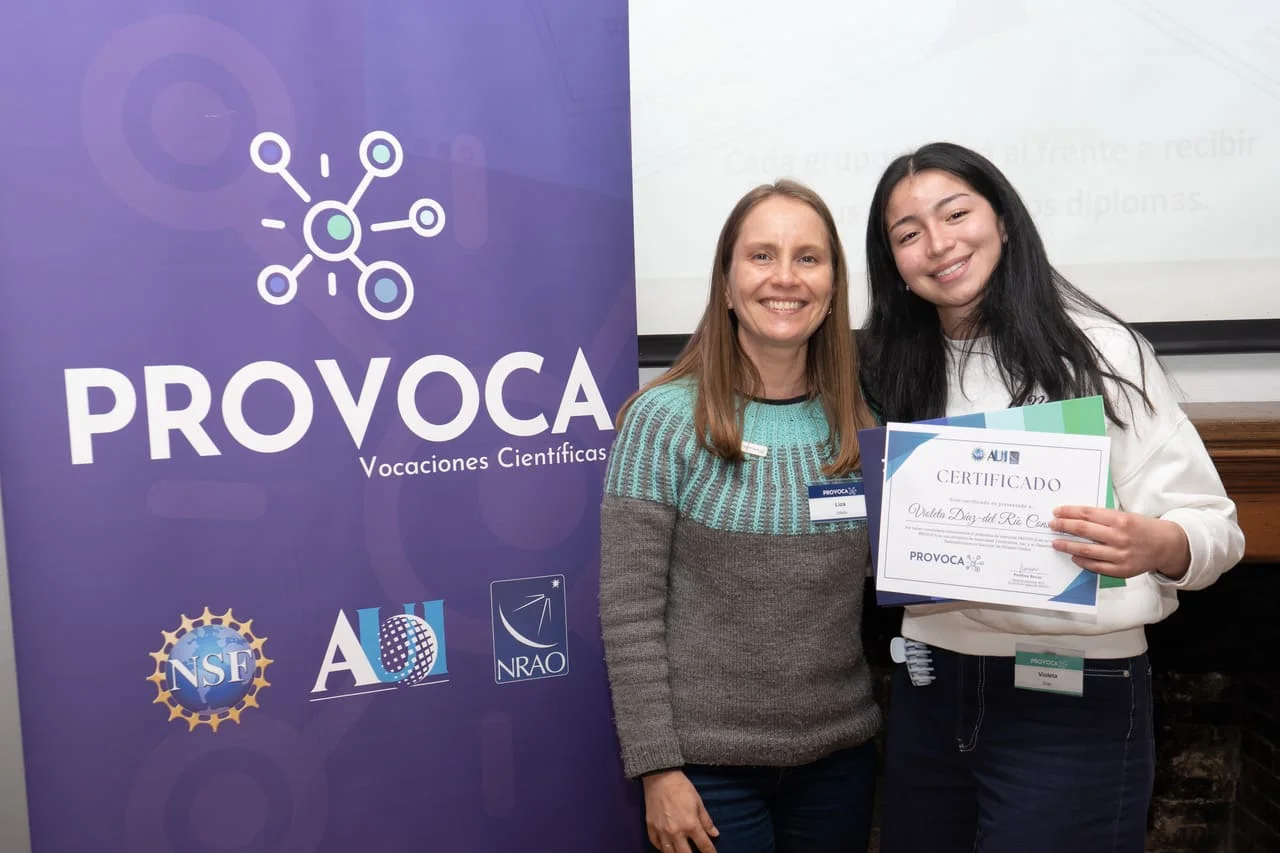 Publicado el: 12/06/2026CATA and PROVOCA are launching a partnership to encourage scientific careers among the next generation
 -
 Publicado el: 01/06/2026CATA Emprende 2026: Four tech startups secure funding
 -
 Publicado el: 18/05/2026Principal Researcher at CATA promoted to Full Professor at the Universidad de Concepción
 -
 Publicado el: 13/05/2026Astronomy and future challenges: CATA researcher presents at INNSPIRAL meeting
Categories list
- Acknowledgments 26
- Astrobiology 11
- AstroCluster 1
- Black holes 19
- Corporativo 70
- Cosmology 6
- Descubrimientos 25
- Disclosure 87
- Exoplanets 17
- Extension 12
- Galaxies 24
- Galaxies formation 9
- Inter y Transdisciplina 5
- Local Universe 19
- Publications 8
- Sin categorizar 34
- Solar System 26
- Stellar formation 11
- Technology 26
- Technology Transfer 29


